Teacher Salaries in Europe 2026: Germany, France, UK and Other Countries Compared
Compare OECD 2026 teacher salary figures for Germany, France, England, Scotland and other systems, with clear data-year and purchasing-power explanations.
Comparing teacher salaries in Europe in 2026 requires a definition before a ranking. Are you comparing an official pay-scale point, the average actually paid across a workforce, or the amount left after deductions? Are the figures in local currency, exchange-rate dollars, or purchasing-power equivalents? Each answers a different question.
This guide uses a deliberately narrow comparison so readers can inspect like-for-like figures. The publication is from 2026; the salary reference year below is 2025. It is not a table of newly announced 2026 pay awards or a forecast of personal earnings.
A comparable OECD salary snapshot
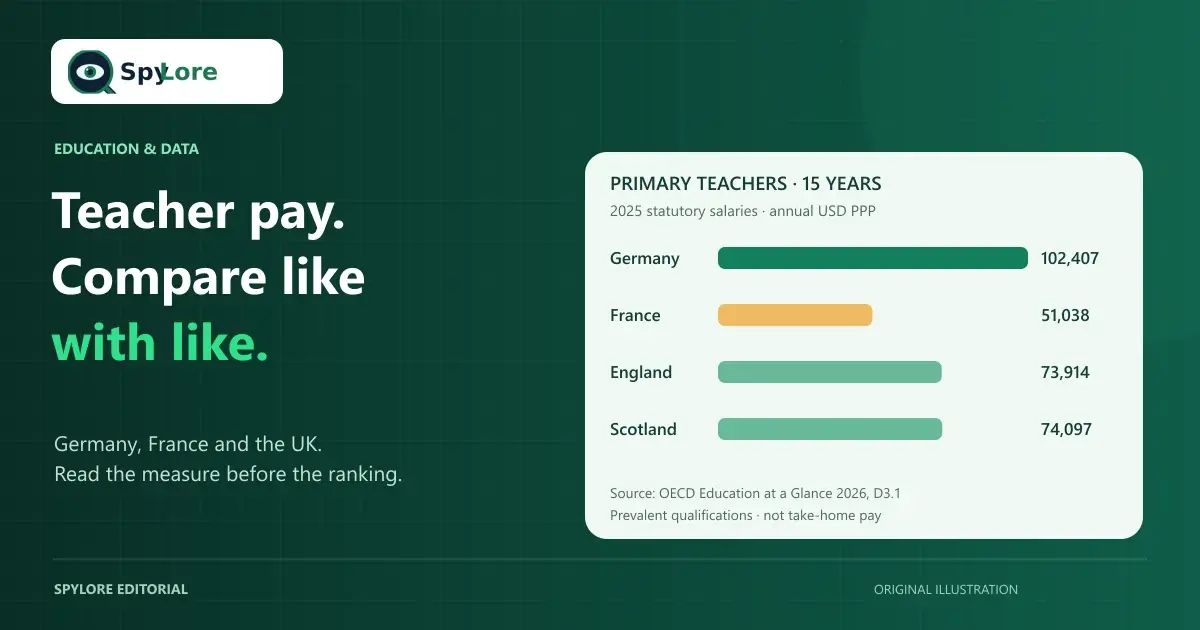
The table selects primary teachers in public institutions, with the most prevalent qualifications, at the start of the scale and after 15 years. Figures are annual statutory salaries in equivalent USD, adjusted using purchasing power parities for private consumption.
Source: OECD Education at a Glance 2026, Table D3.1. These are gross, scheduled salaries—not actual workforce averages or net deposits. The UK entries are England and Scotland separately.
Swipe or scroll to see all columns.
| Country or system | Starting salary | After 15 years |
|---|---|---|
| Germany | 85,496 | 102,407 |
| France | 45,002 | 51,038 |
| England (UK) | 47,897 | 73,914 |
| Scotland (UK) | 59,034 | 74,097 |
| Luxembourg | 96,522 | 140,924 |
| Netherlands | 65,843 | 107,269 |
| Spain | 59,526 | 69,047 |
| Italy | 40,302 | 48,422 |
Publication methodology: the reference period is generally school year 2024/25 or school year 2025. The chapter's print-data cutoff was June 17, 2026. Later national awards and revisions require separate checking. The selected rows contain no missing-value substitutions; we have not filled gaps with estimates.
Germany, France and the UK: what the numbers can tell you
For this particular primary-teacher comparison, Germany's scale points exceed France's. That observation does not establish the net financial advantage of moving between the two systems. You would still need the actual post, recognition of qualifications and experience, location, deductions, housing costs, and household circumstances.
The England and Scotland rows also illustrate why a single “UK teacher salary” can obscure important distinctions. Do not treat either row as a figure for Wales or Northern Ireland. The current Department for Education pay-and-conditions publication expressly applies to England and includes a 2026 document. Use the applicable current national or employer schedule for a real job decision.
Starting and experienced positions should not be mixed in a league table. A new teacher comparing an entry offer with a 15-year scale point elsewhere would be comparing different career stages. Similarly, changing from primary to secondary teaching changes the population being measured.
Statutory, actual, gross and net are different measures
Think of these as four labels to put on every number you encounter:
The OECD's archived salary-indicator definition explains the gross pay-scale basis. That page is useful for the definition, not as a current data release; the numerical comparison here comes from the 2026 chapter above.
- Statutory: a scheduled salary associated with an official scale and specified conditions.
- Actual: an observed average across the relevant workforce, which can reflect its composition and additional payments.
- Gross: a figure before the employee's applicable deductions.
- Net: what remains after the deductions applicable to that person.
Do not relabel this article's statutory table as “average teacher earnings.” To understand the different series, compare the definitions and Table D3.3 in the OECD chapter before downloading data. A conversion from gross to net requires information this table does not contain; no take-home estimates are calculated here.
What purchasing power does—and does not—measure
OECD's purchasing-power-parity explanation describes a way of accounting for price-level differences between economies. PPP equivalents help compare purchasing power. They are not a currency-exchange quotation or a promise about the amount deposited in a bank account.
For example, do not convert a table entry to euros using today's exchange rate and call the result a national salary offer. Return to the official local-currency pay scale for that purpose. If you want national-currency reference data from the same OECD publication, use its Annex 2 reference-statistics tables.
Even a purchasing-power comparison cannot describe every household's budget. A teacher renting alone in a large city and a teacher sharing housing elsewhere can face very different costs. Build a local budget with actual housing, transport, childcare, and other relevant expenses rather than treating a national adjustment as a personalized cost-of-living calculation.
Which European countries pay teachers the most?
There is no meaningful answer without a population and measure. Among the selected rows above, Luxembourg has the highest displayed 15-year figure. This is not a complete ranking of every European country, every career stage, or every type of teacher.
Use a consistent comparison template: education level, institution type, qualification, experience, salary measure, reference year, and currency basis. If any label changes, say so. A narrower comparison with visible limitations is more useful than a dramatic ranking built from mismatched datasets.
A checklist before comparing job offers
- Identify the school system and exact role, rather than relying on the country name.
- Confirm which qualifications and prior service the employer recognizes.
- Obtain the current local-currency scale and the grade or point offered.
- Separate base pay, recurring allowances, and conditional payments.
- Ask which hours, duties, preparation, and holiday arrangements apply.
- Work out deductions and benefits using appropriate current information.
- Budget for the actual location and household, not a national average alone.
- Keep the dataset year separate from the year a comparison article was published.
For day-to-day cover work, use the different framework in our substitute teacher pay guide; an annual statutory salary cannot be substituted for a daily booking rate.
Creating educational resources alongside teaching
Independent resource creation is a separate activity from employment. Salary data does not predict TPT sales, identify a profitable niche, or show that teachers in one country will buy more materials. Check your employment obligations and ownership rights before offering resources for sale.
Start instead with a problem you can solve well: clear classroom directions, thoughtful practice, or a carefully verified assessment. Adapt language, curriculum references, and examples to the buyers you actually intend to serve. Follow our 10-step quality checklist and keep current with the reported TPT AI policy.
If you decide to publish an independently reviewed resource, SpyLore's listing tools can help make the description clearer. That is a research and communication workflow, not a promise of additional income.
Improve Your TPT SEO With SpyLore
Research relevant keywords, improve listing clarity, and explore tools built for Teachers Pay Teachers sellers. Start with the Free plan and compare the current Pro features and billing terms when you need more.
SpyLore is independent and is not endorsed by TPT. Research tools do not certify resource quality or marketplace compliance.